The Hertie Institute for AI in Brain Health improves early diagnosis of diseases of the nervous system and their prevention with the help of artificial intelligence.

Brain Mapping City Walk

Light installations in Tübingen's old town, November 2026

The Hertie Institute for AI in Brain Health invites you on an evening walk through Tübingen's old town and into the world of AI and neuromedical research. For two evenings, buildings along the route become projection surfaces for light installations.

Everything you see comes from the research itself. Brain imaging and AI make visible what usually stays hidden: how the brain changes over time, and what happens in neurodegenerative diseases. Researchers work with these images every day. Here, they are projected onto facades at a scale that's hard to walk past.

The Brain Mapping City Walk is part of the Science & Innovation Days 2026 November 6th +7th. 
Participation is free and the walk can be started at any time after sundown at one of the four locations.

In addition there will be two guided walks on each evening starting 5 pm (German)  and 6 pm (Englisch).
Meeting point guided walks: KI-Makerspace, Neckawa (Wöhrdstraße 25)
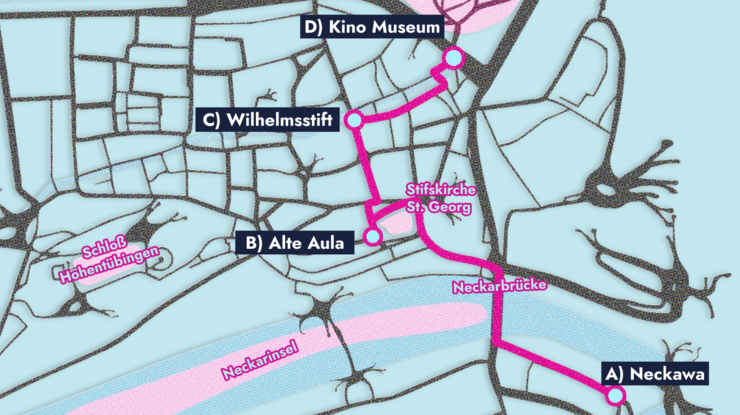
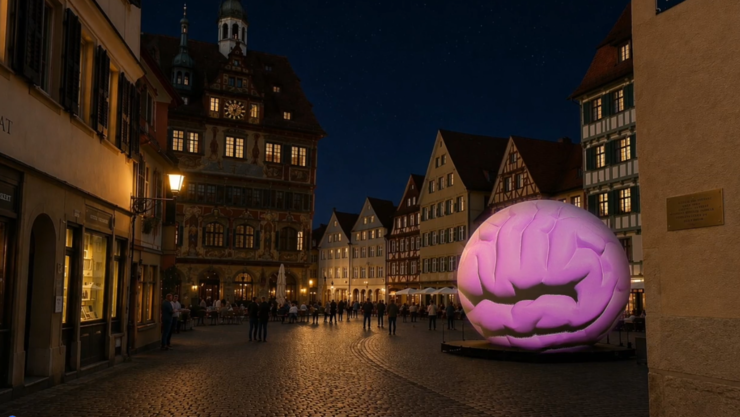
A | Festivalcenter at the KI-Makerspace

The Brain Mapping City Walk begins here, with a look into the eye. The “Brain Balloon” turns into a giant eyeball that glances curiously from side to side. We also look behind the iris: medical images of the back of the eye, known as fundus images, show the retina, its blood vessels and the optic nerve, which carries signals from the eye to the brain.

The retina is more than just part of the eye. It develops from the same tissue as the brain and, strictly speaking, belongs to it. It is the only place in the body where nerve tissue and blood vessels can be seen directly from the outside, without any intervention: a window to the brain, in a sense. That is why changes in the retina can give early signs of disease.This is where the research at Hertie AI comes in. We develop machine learning methods that turn large amounts of neuroscientific data into insights for medicine. The goal is to use artificial intelligence to detect diseases of the nervous system earlier and to prevent them from developing in the first place.

How it works: For doctors to trust an AI, it has to show what it is paying attention to and how it reaches its decisions. The video shows three ways of doing this, using the example of age-related macular degeneration (AMD), one of the most common causes of severe vision loss in older age.

The video: First, the AI uses coloured boxes to mark the spots on the retinal image that catch its attention. Next, you see a kind of map on which the AI has sorted retinal images by similarity. Imagine a large table on which thousands of photos are laid out so that similar ones lie next to each other. Each dot is one of these photos, or more precisely, a small section of a retinal image. So the dots are not locations in the eye. The colours show how far the disease has progressed in each image: green stands for little AMD, orange and pink for the two late forms. The remarkable thing: the AI arranged the images by itself so that the mild cases are at the top and the severe ones at the bottom. The lines follow individual eyes over several years. Each examination is a stop on the map, and with each visit the eye moves further down, to the star: the point at which the late form was diagnosed. This shows how the AI recognises the course of a disease. Finally, the video shows risk maps over seven years. Much like a weather map, the AI colours in where it sees risk: blue and green stand for low risk, pink and red for high risk. From one examination to the next, the risky zone in the centre grows in two eyes, long before the people affected notice anything themselves. At the end, the Brain Balloon turns into a brain: the eye is our window into it.

Location: KI-Makerspace at Neckawa, Wöhrdstraße 25, 72072 Tübingen

B | Alte Aula

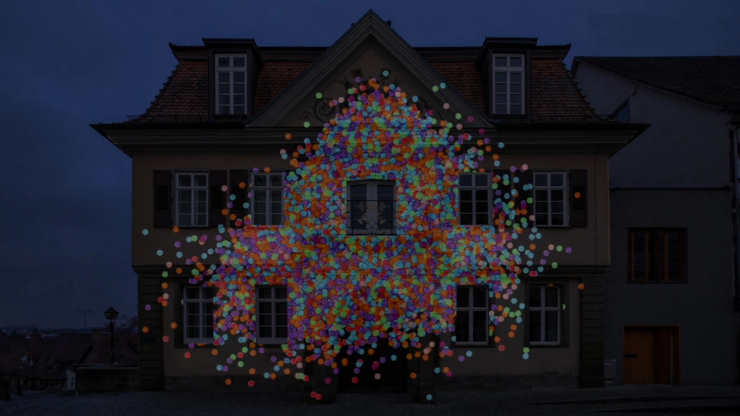
Imagine having around 21 million medical and biological research papers in front of you, covering much of what has been published in these fields over the past few decades. How would you get an overview? Which research areas exist, how are they connected, and how have they changed? A regular search finds individual papers that match your keywords, but it can’t show you the bigger picture. That is why researchers at Hertie AI have created a map of the entire biomedical literature. Each paper is shown as a dot. Papers on similar topics sit close together, and papers on very different topics end up far apart.

How it works: A language model trained specifically on biomedical texts (PubMedBERT) reads each paper’s abstract and translates its content into a long sequence of numbers. A method called t-SNE arranges these sequences on a flat map so that similar papers sit next to each other. This creates small and large clouds that together look like a view into the universe. The resulting map is based only on the text of the abstracts. Citations and other metadata play no role.

The video: “With AI, complex datasets can be organised, visualised and made understandable.” The video opens with this sentence. Then excerpts from individual research papers overlap, more and more, until they can no longer be told apart: this is how the flood of new publications feels to researchers. The papers then turn into individual dots and finally into the map of science. After a while, the map changes and shows some of Hertie AI’s research areas, including neuroanatomy, glial cell research, functional MRI, psychiatry, ophthalmology, epilepsy, Parkinson’s research and digital biomarkers. The image zooms further and further into the map until individual publications become visible as dots, and we arrive at the dot belonging to the paper “The landscape of biomedical research”. This is where our journey through the map ends: at the place that made the map possible in the first place. After that, further point clouds from other data sources move across the facade: depending on the viewpoint, different structures emerge. The idea behind it: AI organises huge and diverse amounts of data, and good visualisation is what makes them understandable for people.

Find out more: An interactive version of the map is available online.

Location: Münzgasse 30, 72070 Tübingen

C | Tower in Lange Gasse

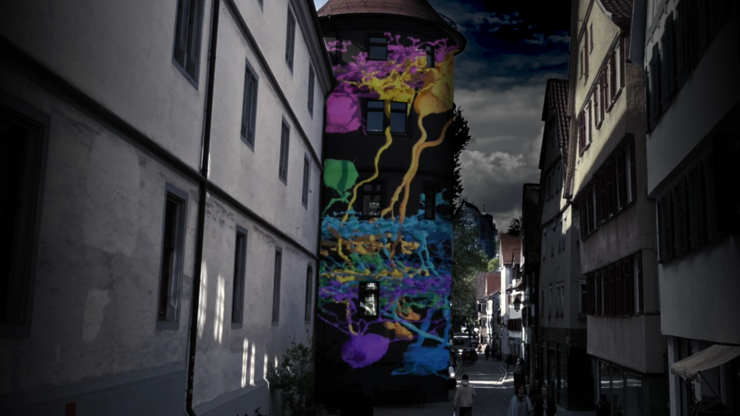
The retina is part of the brain. It is not a simple camera that passes an image on to the brain, but is made up of many different nerve cells that are tightly connected to one another. Images are already processed here, before they even reach the brain: some cells respond to movement, others to contrast or to particular colours. So the brain does not receive a single image, but many parallel reports about what is happening in the field of view.Understanding how a healthy neural circuit is built also helps us understand what goes wrong in disease. The retina is particularly well suited for this: it is a comparatively manageable piece of brain and very well studied. What we learn here about how nerve cells are wired also helps us better understand other parts of the nervous system.

Researchers in Tübingen have shown that among the cells that send signals from the mouse retina to the brain alone, there are more than 30 different types. How exactly these cells are connected, and how their functions arise from that wiring, is still not fully understood. Researchers at Hertie AI in Tübingen want to change that. In the project “Eyewire II”, they are creating the first complete wiring diagram of a mouse retina, comparable to the circuit diagram of an electronic device, only vastly more complex. Understanding how a healthy neural circuit is built also helps us understand what goes wrong in disease. The retina is particularly well suited for this: it is a comparatively manageable piece of brain and very well studied. What we learn here about how nerve cells are wired also helps us better understand other parts of the nervous system.

How it works: The project brings together two things that are usually studied separately: what the cells do and how they are connected. First, the researchers show the retina light stimuli and watch under a two-photon microscope which cells become active. Active cells light up. Then the same tissue is cut into ultra-thin slices, much thinner than a hair, and imaged with an electron microscope at such high resolution that even the smallest contact points between cells become visible. From thousands of these slice images, a three-dimensional model is built. The amount of data is so vast that people cannot analyse it alone. That is why machine learning methods do much of the work: they recognise cell boundaries and connections automatically, and people check and correct the results.

The video: “The retina is part of the brain.” After this sentence, nerve cells grow up the tower, reconstructed in 3D from such microscope images. Along the way, individual cells appear one after another, each with its own shape, because a cell’s shape reveals a lot about its job. As the tower shows, nothing in the retina is neatly arranged: the cells overgrow and overlap one another like dense undergrowth. That is exactly why AI is needed to trace them.

Find out more:  Eyewire II

Location: Lange Gasse 3–5, 72070 Tübingen

D | Kino Museum

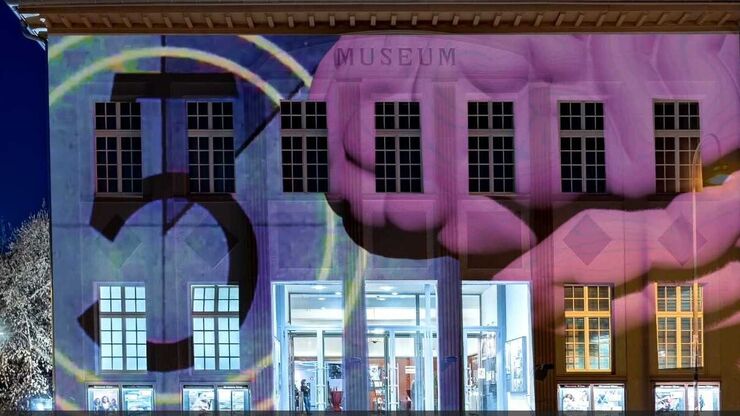
To understand how the brain thinks, feels or remembers, researchers often place people in an MRI scanner and give them tasks: looking at faces, memorising numbers, pressing a button. The scanner measures which brain regions become active, and when. This method is called functional magnetic resonance imaging (fMRI). These studies are expensive and time-consuming, and each new question usually needs a new study, with new participants and many hours of scanner time. Researchers at the Hertie AI are looking for an alternative. Their question: could an AI model predict what brain activity looks like during a task that no one has ever measured in a scanner?

How it works: The researchers have developed an AI model that generates artificial but realistic brain activity. Rather than a single snapshot, it produces activity as it unfolds over time, a kind of film. The idea is similar to AI programs that create images from a text description: you describe to the model in words which task a person is doing, for example “looking at faces”. The model starts with pure noise and shapes it, step by step, into a signal that looks like real brain activity during exactly that task. It learned from real measurements in which people solved many different tasks in a scanner. What makes it special: the model also works for tasks it never saw during training. The researchers tested it on hundreds of such new tasks, and from the description in words alone, it predicts which brain regions are involved. To their knowledge, it is the first model that can do this for the entire cerebral cortex. The model is not meant to replace real measurements. But it could help run new experiments on the computer first, before they take place in a scanner: which task is worthwhile, and how many participants are needed? This would be a big gain especially in clinical research, where long scans are often a burden for patients and data are correspondingly scarce. In the long run, such models could also help us understand why brains work differently from person to person, and detect neurological diseases earlier.

The video: “From the screen into our brain: welcome to the cinema in your mind!” After a classic film countdown, the video shows images on the left and a brain whose colours change on the right. The colours show which brain regions are particularly active at that moment: a face lights up different areas than a tool or a place. The images come from typical brain research tasks, such as those used in the large international Human Connectome Project: memorising faces, places or tools, comparing emotional expressions, matching shapes. The question mark and the red arrow belong to a small card game in which you guess whether a hidden number is higher or lower than five. The twist: the brain images in the video do not come from a scanner. They were generated by the AI model. Or, as the text running across the top of the facade puts it: “Images influence our brain. AI research makes them predictable, in order to detect neurological diseases earlier.”

Find out more: An online Animation shows how the model generates brain activity.

Location: Am Stadtgraben 2, 72070 Tübingen